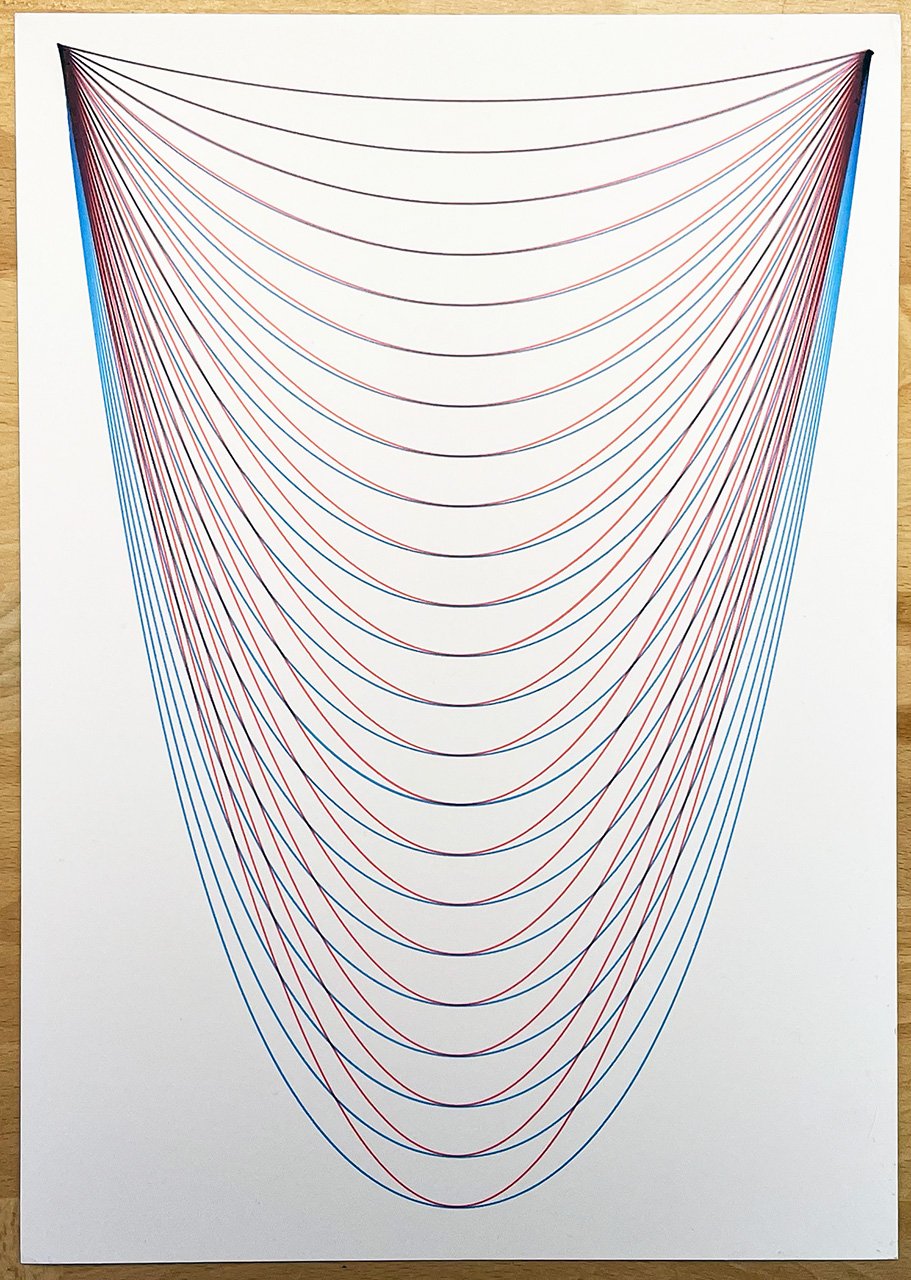
Catenary vs parabola, blue and red on white, A3
- Colour
- blue and red on white
- Paper
- A3
- Dimensions
- 27 × 40 cm
All series ‹ Previous series Next series ›
other, 1 plot

The curve of a hanging chain or rope is a so called catenary. It looks very much like a parabola. It is said that Galileo thought it was a parabola but that seems to be a myth. The equation of the catenary was derived by my hero Christiaan Huygens (amongst others): y=a(cosh(w/a)-1) where a is the parameter which is the solution to the equation: a(cosh(w/2a)-1) (I could only find a numerical solution), w is the width and h is the height of the catenary. Of course the equation for the parabola is: y=(2x/w)2. See: https://en.wikipedia.org/wiki/Catenary In this plot I have drawn various catenaries (blue) and parabolas (red). Always starting at the same point and having the origin at the same place. As you can see, long catenaries and parabolas differ the most.